
Proptech Earnings Radar - Q4 2023 (Series IV, Part III)

Fourth quarter results are finally (mostly) in for proptech’s public companies. We’re back at it, with high-level summaries of the ten companies we deem as the most important players in the broader category, and a table view covering the top thirty one companies.
Without further ado, let’s get into it...
Note: All market cap figures are taken end of day, March 19th, 2024.
COMPANY SNAPSHOTS
Reporting $2.2B in revenue for the quarter, Airbnb grew its top-line 17% YoY. The 98.8 million nights and experiences booked for the quarter was up 12% YoY and their largest fourth quarter highest quarter in company history. Surpassed 5M hosts globally, with active listings coming in at 7.7M to end 2023 (an increase of 18% YoY).
Market Cap: $104.7B
Notable Takeaways:
- $15.5B in gross booking volume, a 15% YoY increase. Partly driven by Average Daily Rate coming in at $156.73 in Q4. For perspective, in Q4 of 2019, the rate was $112.63.
- Q4 net loss was $349M, with withholding expenses and lodging tax reserves set around $1B. Excluding non-recurring tax charges, adjusted net income was $489M.
- Generated $46M in Free Cash Flow (FCF) for the quarter and $3.8B for FY2023.
- 36% of new hosts were prior guests, while host cancellations decreased 36% YoY.
- Repurchased $750M in Class A common stock.
- International guests booking properties in North America increased by 15% YoY.
Learn more: Shareholder Letter // Inman // PhocusWire
With $36.1 million in topline revenue, Blend Labs reduced its GAAP overall loss from operations to $30.377M in Q4, down from $81.44M from Q4 FY22. Non-GAAP profitability is a management expectation for FY24.
Market Cap: $819M
Notable Takeaways:
- Q4 revenue ($36.1M) decreased 15.61% YoY, composed of Blend Platform segment revenue of $25.9M and Title segment revenue of $10.2M
- Mortgage Banking Suite revenue decreased by 3% YoY to $17.2M, even with an overall 20-25% mortgage market volume decrease serving a primary sector headwind.
- Both GAAP and Non-GAAP segment blended gross profit margin was approximately 55% this quarter, up 34% and 35% YoY for GAAP and Non-GAAP figures, respectively.
- Mortgage Suite economic value per funded loan rose to $91 this quarter from $86 sequentially in Q3 of this year and up from $81 in Q4 FY22, beating the company goal of reaching $90 per loan by the start of FY24.
- Paid down $85M of principal on their five year term loan, starting at $225M and decreasing overall debt to $140M after the repayment. Ended the quarter with $144.2M in cash and cash equivalents.
- Guidance set Non-GAAP loss between $14 and $12M off of $32.5M- $35.5M in revenue from 800k - 875K aggregate industry mortgage originations.
Learn More: Press Release // Defense World
Compass generated $1.096B in revenue from 40,621 transactions, a YoY decrease of 1% and 4.9%, respectively. 14,689 principal agents on average worked under the Compass name, a 7.7% increase from last year’s Q4 of 13,1643.
Market Cap: $1,459B
Notable Takeaways:
- Posted a GAAP Net loss of $83.7M for the quarter, a 47% YoY improvement from the $158.1M net loss this same quarter last year, primarily due to a $57.8M reduction in non-cash expenses such as stock based compensation, depreciation and amortization.
- Adjusted EBITDA (Non-GAAP) for the quarter improved $51.6M or 69% YoY to a loss of $23.6M, driven primarily by a $58M YoY decrease in non-commission based operating expenses.
- Gross Q4 transaction volume was $41.8B, a 2% YoY decrease, with national market share at 4.41%, a 9 bps YoY increase.
- Decreased cash on the balance sheet by 53.3%, largely due to a $225M repayment of drawdowns on a revolving credit facility. At the end of the year, the company had $1.16B in current assets and $728.3M in current liabilities.
- Guidance set full year 2024 operating expenses at $865M. For context, this does not include commission expenses, which totaled $895.9M alone for this quarter. Q1 revenue and adjusted EBITDA set at a midpoint of $1.025B and losses of $31M, respectively.
CoStar had another quarter that exceeded company expectations for revenue and non-GAAP EPS, generating $640M (up 12% YoY) and $0.33 (down 13% YoY), respectively. Net income came in at $96M, a 22.5% decrease from the same quarter last year.
Market Cap: $38,431B
Notable Takeaways:
- A decrease in net income YoY was largely driven by a 28.9% YoY increase in operating expenses for Q4, from $336.9M in Q4 FY22 to $434.5M to Q4 FY23. Selling and marketing expenses were the single largest contributor for the change, increasing $73M YoY.
- Homes.com had a 600% YoY increase in average monthly unique visitors, with their entire suite of residential network traffic reaching a peak of 95M average unique visitors for the quarter.
- Apartments.com is now the single largest business within CoStar Group, with roughly 71,000 apartment communities advertising on the platform, and revenue growth rates expected to be between 17% and 18% for FY 2024.
- Balance sheet remains healthy with $5.46B in current assets, compared to $455M in current liabilities at the end of the quarter.
- The Super Bowl marketing blitz already having an impact with the first week after the campaign generating almost $4.5M in net new bookings. Further ads are planned for the Olympics, Oscars, Emmys, March Madness, U.S. Open, the Stanley Cup playoffs, Major League Baseball, and more according to CEO Andy Florance.
- Building out a sales team dedicated just for Homes.com, with 100 sellers to date with a plan to expand to 300 by the end of the year, with a focus on operating a salesforce selling to agents in their own neighborhoods.
- Guidance revenue set in the range of $2.75B to $2.77B for the full year of 2024, representing year-over-year growth of approximately 12% to 13%, Q1 revenue set between $640M and $645M.
Learn More: Press Release // Inman // RISMedia
With $983M in top line revenue for the quarter and a net loss of $21.2M, eXp missed on earnings expectations, reporting a loss of $0.14 EPS (expectations were $0.045). While agent count fell from 89,156 at the end of Q3 to 87,515, the number is up 2% YoY.
Market Cap: $1.43B
Notable Takeaways:
- Despite a 5% YoY quarterly revenue increase to $983M, gross profit decreased 14.7% YoY to $70.853M.
- North American revenue in Q4 increased 5% YoY to $965.4M, but adjusted EBITDA for the same segment decreased 29.11% (was the only segment to post a positive number). The company generated $0.5M adjusted EBITDA in total across all segments compared to $3.6M in the prior-year quarter.
- Q4 International revenues increased 67% YoY to $16.23M.
- Transactions were down roughly 2% for the quarter.
- MyExP app, currently in beta, will serve as a central hub for agents and will be released in a few months, according to Chief Strategy officer Leo Pareja.
- As of Dec. 31, 2023, cash and cash equivalents totaled $126.9 million, compared to $121.6 million the same time last year.
Learn More: Press Release // Inman // Real Estate News // HousingWire
NewsCorp’s digital real estate services segment revenues in the quarter increased $33 million, or 9% to $419M. Real Estate Services EBITDA was up $19M (15%YoY). Average monthly uniques of Realtor.com's web and mobile sites for the fiscal second quarter was flat compared to the prior year at 66 million.
Market Cap: $14.876B
NewsCorp’s digital real estate services segment revenues in the quarter increased $33 million, or 9% to $419M. Real Estate Services EBITDA was up $19M (15%YoY). Average monthly uniques of Realtor.com's web and mobile sites for the fiscal second quarter was flat compared to the prior year at 66 million.
Notable Takeaways:
- Move’s revenues in the quarter decreased $19M, or 13% YoY, to $127M.
- Notes on their Australian performance:
- Australian business posted record quarterly revenues of $292M, a 22% increase compared to the prior year, primarily driven by robust Australian residential performance
- Australian national residential buy listing volumes in the quarter increased 8% compared to the prior year, with listings in Sydney and Melbourne up 22% and 24%, respectively.
Learn More: Press Release // Inman
Opendoor sold 2,364 homes for the quarter, and came in with topline revenue of $870M, a decrease of 69.5% YoY. Gross margin was flat YoY at $72M ($71M in FY22), but overall net loss decreased from $399M in Q4 FY22 to $91M in Q4 FY23.
Market Cap: $1.862B
Notable Takeaways:
- Does not expect to achieve a positive adjusted net income for a quarter in 2024 due to lower transaction volumes. To breakeven, the company predicts they need to sell roughly 2,200 homes a month at a contribution margin between 5-7%.
- Purchased 3,683 homes for the quarter, an increase of 17% sequentially, or 18,708 homes for the whole year, a 52% decrease YoY. Of their old book of homes, only 75 homes have yet to be sold, an indicator the company is turning a page on operating expectations, as homes on their old book significantly harm profitability.
- Current assets for the year at the end of 2023 totaled $3.45B, a stark decrease from FY22 where current assets were $6.466B, caused primarily by the decreasing amount of real estate held on their balance sheet ($4.46B in FY 22 vs $1.775B at the end of FY23).
- Current liabilities decreased from $1.550B at the start of FY2023 to just $70M at the end of the year.
- Exceeded management guidance for Q4 homes sold, bought, as well as gross profit and net loss.
- The company has been looking for a permanent CFO since December 2022, with Christy Schwartz acting as the interim CFO since.
- Increased marketing, such as its Super Bowl commercial, is one of their 24 initiatives, after decreasing marketing efforts 60% in 2023.
Learn More: Shareholder’s Letter // Inman // RISMedia // Real Estate News
Surpassing $1B in annual recurring revenue in Q4 in 2023, ProCore Technologies generated $260M in topline for the quarter, a 26% YoY increase. After adding 300 net new customers, the quarter ended with a total of 16,387 customers.
Market Cap: $11,505B
Notable Takeaways:
- GAAP gross margin was 82%, a 2% increase from FY22.
- Negative 14% (an increase of 25% YoY) and 7% (an increase of 15%) were the operating margin and non-GAAP operating margin, respectively.
- Guidance revenue set between $1,137M and $1,142M for the full 2024(a 20% YoY increase), and set between $262M and $264M for Q1 2024 (23% to 24% growth). Non-GAAP operating margin is expected to range between 7% and 8%.
Learn More: Press Release
Redfin’s Q4 revenue was $218.1M, a 2% YoY decrease. Gross profit increased 32% YoY to a tune of $73.2M. Site traffic the quarter remained steady at 44M average monthly visits.
Market Cap: $664M
Notable Takeaways:
- Net loss was $22.898M for the quarter, compared to last year’s loss of $61.947M. This is largely attributed to the non repeating loss of $35M from discontinued operations in FY22.
- The split of its 62,000 total transactions was 57% buy side and 43% sell side for the full year.
- Real estate services segment revenue generated $133M, down 9% YoY. Brokerage revenue specifically was down 11%, on a 20% decrease in brokerage transactions. Net loss for the segment was $21M, a 25% YoY improvement.
- The rentals segment posted its fifth straight quarter of growth, with revenue of $49M, a 20% YoY increase. Rentals gross margin increased 110 bps YoY to 77.5%. Net loss for rentals was $10M, down from a net loss of $22M the same period last year.
- Despite a 13.9% expansion in gross margin (-8.6% and 4.9% for Q4 in FY22 and FY23, respectively), mortgage segment revenue decreased 8% YoY to $26M for the quarter.
- Share of home sales brokered was .72%, down from .76% in Q4 FY22 and from .78% in Q3 FY23.
- Increased gross margins by 9% YoY, to 34% by lowering operating expenses by $64M.
- In the four markets that are piloting Redfin Next (rebranded from Redfin Max to avoid confusion with Re/Max) revenue is up 33% for January and February, while the rest of the brokerage is down 1%. Redfin Next agents are profitable after selling only four homes a year, previously profitability required 7 homes.
- Guidance set total net losses between $72M and $65M, with adjusted EBITDA loss to be between $36M and $29M. The company deferred Q1 mass media advertising, hosted a virtual sales kick off, and is limiting employee travel to reach those figures.
- Management expectation to achieve breakeven EBITDA by 2024 is still on the table.
Learn More: Press Release // Inman // Housing Wire
Zillow’s Q4 exceeded the company’s median outlook for revenue and adjusted EBITDA, generating $474M (up 9% YoY) and $69M, respectively. Residential revenue was up 3% year over year in Q4 to $349M, and their Rentals segment generated $93M, a 37% YoY increase.
Market Cap: $11,169B
Notable takeaways:
- Mortgages revenue was $22M for Q4, an increase of 22% YoY.
- Posted a GAAP net loss of $73M.
- Cash and investments at the end of Q4 were $2.8B, down $500M over the course of the quarter.
- Multifamily success was a main contributor to the rental segment breakout, primarily driven by multifamily revenue growing 52% year over year in Q4.
- They had $487M in purchase loan origination volume in Q4, a more than 100% YoY increase.
- Cost of revenue grew 29% YoY, from $89M to $115M.
- The company spent $400 million on the Follow Up Boss acquisition.
- Guidance for Q1 FY2024 total revenue set at $495M to $510M, with adjusted EBITDA set between $95M and $105M
- The company is investing heavily in the following touring, financing, seller solutions, partner network enhancements, and service integrations to double their overall transaction market share from 3% to 6% by the end of 2025.
Learn More: Shareholder Letter // Press Release // Inman // Real Estate News
WRAP-UP
The thirty one companies covered in the table below represent a combined $248,999 billion in market capitalization (as of March 19, 2024).
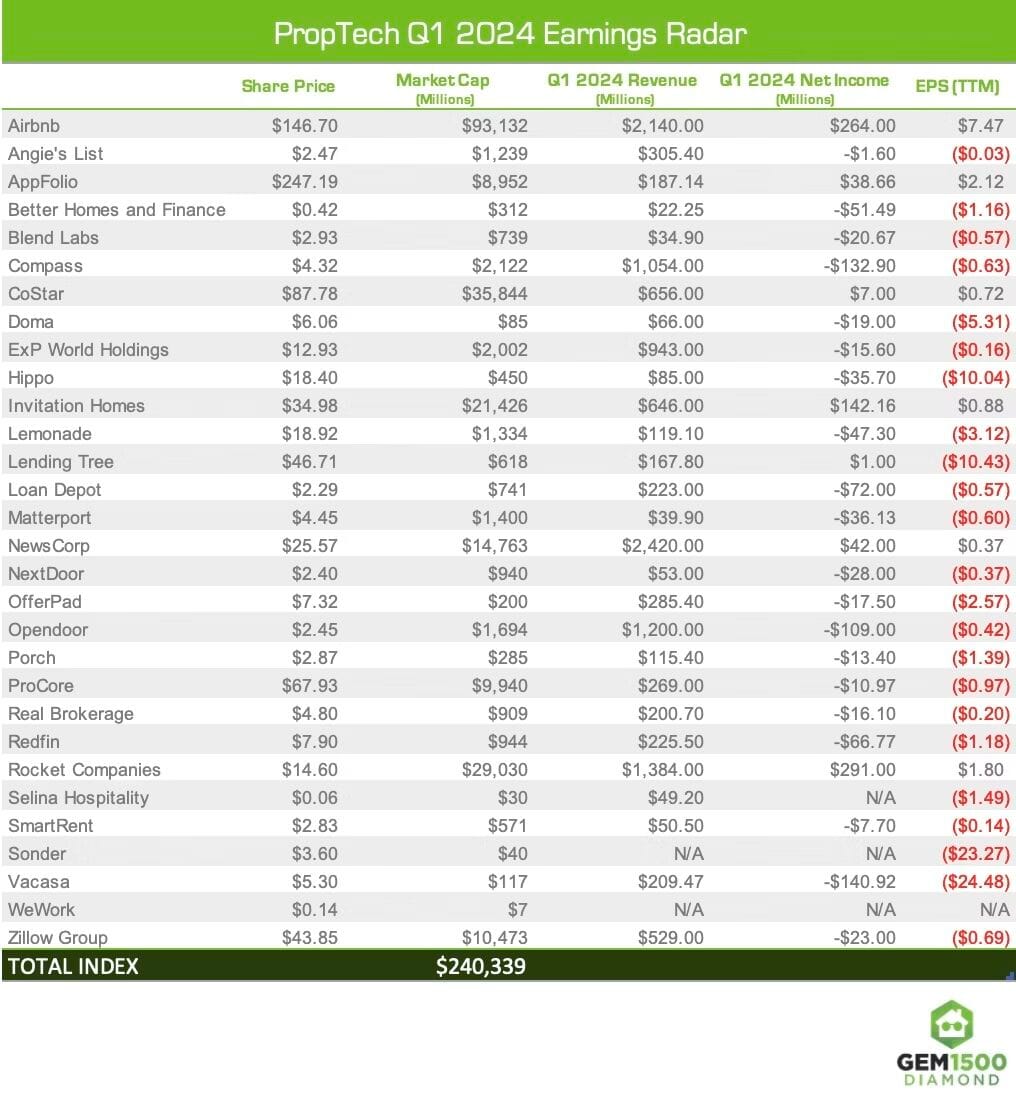
Editor's Note: This chart now includes App Folio, Better Homes and Finance, Doma, Hippo, Invitation Homes, Lemonade, Lending Tree, Loan Depot, and Rocket Mortgage to reflect the current holdings of the GEM Proptech Portfolio. Better, Selina, Sonder (which just announced two years of financial misstatements), View, and WeWork have not yet released earnings or are not eligible to release earnings, hence their Q4 results are listed as N/A. Stock prices and market caps are current for these companies. The last four companies in that list are under consideration for removal from the GEM Proptech Index.
The "Big 3" (Airbnb, CoStar, Zillow) make up 61% of the total proptech index. This is down considerably from Q3, but we've added a couple of big market cap companies to the list (Invitation Homes and Rocket Companies). Only four companies posted net income for Q4, not exactly painting a rosy picture for proptech investors.
The NAR settlement sent all residential stocks reeling at the end of last week, but are showing signs of recovering. The public markets appear particularly bullish that CoStar will emerge stronger strategically as a result (see 5 day chart below). With compensation being removed from the MLS, maybe now is CoStar's time to launch a compensation marketplace across the country.
What's to come in Q1 2024? More restructuring, more residential upheaval, and more office vacancy turmoil. It's going to be interesting...
This document is for informational purposes only and does not constitute financial, investment, legal, or tax advice. The content provided herein is provided on an "as is" basis without any warranty of any kind.
The information contained within this document is not intended to be a source of advice or investment analysis with respect to the material presented, and the information and/or documents contained in this document do not constitute investment advice.
The reader should consult with a qualified professional for advice regarding their individual situation before making any investment decision. No aspect of this document is intended to provide, nor should be construed as providing, any investment, tax or other professional advice. You should not rely on any material in this document to make (or refrain from making) any decision or take (or refrain from taking) any action.
The author and publisher of this document are not responsible for any actions taken as a result of reading this document, including but not limited to any loss or damage in any form suffered. Investments can go down as well as up and past performance is not necessarily indicative of future results.
Please be aware that all investment strategies and investments involve risk of loss, including the potential loss of all invested capital. Thus, funds invested are not guaranteed and there is a risk that you could lose some or all of your investment.