
Proptech Earnings Radar Pt. 2 - Q3 2025 (Series V, Part X)

Q3 results are in for many of proptech’s public companies.
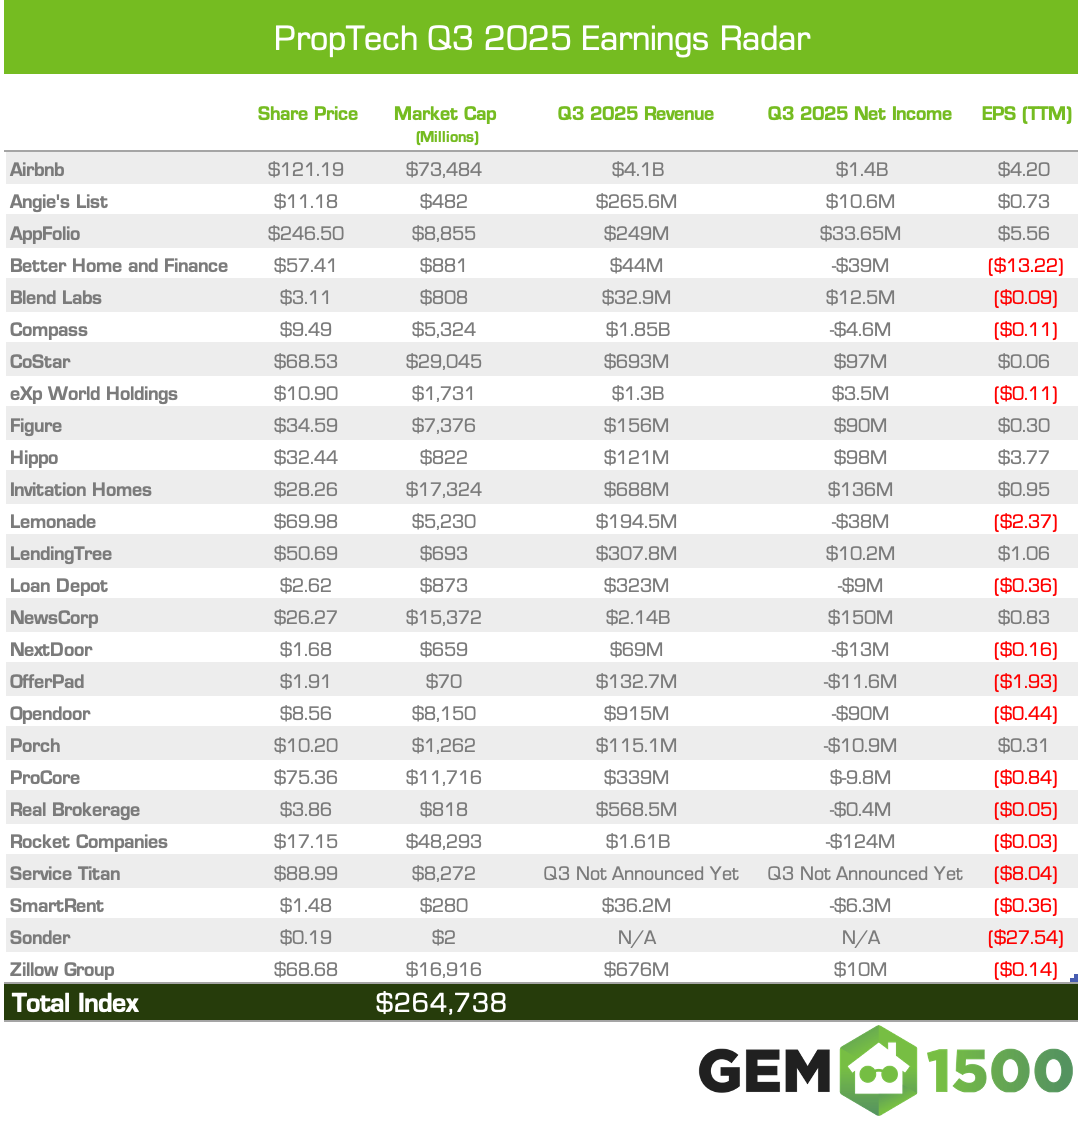
In part 1, we shared earnings summaries and links to the full articles for each of the the ten companies we deem as the most important players in the broader category. This part 2 is the wrap-up that includes a table covering the performance of the 26 companies in the GEM Proptech Index.
Without further ado, let’s get to it.
The 26 companies covered in the table below represent a combined market cap of $264.738B (as of November 13, 2025). Since Q2’s report (August 12, 2025), the GEM Proptech Index is up 3.55% sequentially, and 14.65% YoY. (For comparison, last year’s Q3 report covered 27 companies with a combined market cap of $230.905B)
The “Core 4—Airbnb, CoStar, Zillow, and Rocket—still represent nearly two thirds of the total index value (63.36%), but decreased by 246 bps from Q2 (65.82%), and 404 bps YoY (67.40%).
Full chart & takeaways are below...
Leadership changes at Procore and Opendoor weren’t sector-defining moments, but they framed the quarter well: a founder exiting a company with a clear, hard-earned identity, and a new operator arriving at a company working to recover its own. That contrast echoed throughout the rest of proptech’s Q3 results, where companies revealed who they’ve become, not through guidance or positioning, but through the choices evident in their operating models.
Identity Solidified
Procore and CoStar didn’t just perform, they reinforced identities that have been consistent for years.
Procore’s final earnings call under Tooey Courtemanche leadership as CEO showcased the outcome of a 23-year singular focus. The company moved from a 4.8 million dollar business in 2012 to roughly 400 million by 2020 (per Wikipedia) because it never chased tangents or adjacency narratives. Q3 reflected that same steadiness: operating margins expanded meaningfully, operating expenses grew only a few percentage points year over year, and six-figure ARR customers rose at a strong double-digit pace with gross retention holding at 95 percent. Procore’s identity, long-cycle discipline and vertical depth, took over 20 years of durable compounding and dedicated focus to achieve. Tooey didn’t hand off a company needing reinvention. He handed off one already aligned around what it was always meant to be.
CoStar, meanwhile, continued operating with the consistency only a fully internalized identity enables. Subscription growth stayed strong, bookings accelerated sharply with net new bookings up nearly 90 percent year over year, and Homes.com continued gaining traction without sacrificing the company’s trademark defensibility, adding more than 7,000 agents in the quarter and lifting residential traffic to more than 115 million monthly uniques. Apartments.com delivered another double-digit revenue increase, and Domain reached record audience highs immediately after acquisition. Even the time Andy Florance spent addressing IP protection and the lawsuit against Zillow reinforced the cultural throughline: CoStar sees data as infrastructure, not content, and treats its protection as a strategic obligation.
Identity Diversifying
Zillow and Airbnb each expanded their strategic surface area, but at different levels of maturity.
Zillow’s mix shift is now unmistakable. Mortgages grew materially as purchase activity rebounded more than 50 percent year over year, rentals expanded again with multifamily inventory up 47 percent, and Showcase adoption continued to deepen within listing flows, with penetration now above the 3 percent mark and still climbing. Engagement across Zillow’s app ecosystem also rose, with monthly uniques reaching roughly 250 million and time-spent improving year over year. Zillow isn’t relying on any single business line to define its future. Instead, it’s building three engines, For Sale, Rentals, and Mortgages, that balance each other across cycles. The identity forming here is one of a multi-line housing platform rather than a leads-driven marketplace.
Airbnb’s identity shift is earlier and more subtle. Core travel fundamentals remain strong, with nights growing at a high single-digit rate, gross booking value increasing, and app-booked nights reaching more than 60 percent of total bookings. The more telling signals are margin compression, higher reinvestment, and the slow buildup of infrastructure improvements across mapping, host tooling, financing, and discovery. Experiences remained more directional than economic this quarter. 110,000 hosts applied, but the business hasn’t yet scaled into a true second line of revenue, and the segment’s contribution remained immaterial relative to room nights. Airbnb is preparing for its next curve, but it hasn’t arrived. The current identity is a maturing marketplace investing ahead of its next chapter.
Identity Under Reconstruction
Opendoor and Blend both showed the fingerprints of businesses in the middle of a rebuild, one structural, one mix-driven.
Opendoor’s struggles weren’t disguised: aged inventory, with more than half of homes listed over 120 days, slow turn times, and an operating model that drifted away from the speed and precision it was founded on. Acquisitions fell sharply year over year and resales declined sequentially, pushing contribution margins down from prior quarters. Kaz Nejatian’s early moves, reducing underwriting touchpoints from multiple reviewers to one with AI assist, rebuilding acquisition volume as weekly pace roughly doubled from early-quarter levels, and reestablishing discipline around cycle times, speak to an identity restoration effort, not optimization. The company isn’t aiming to survive; it’s aiming to rediscover the model that once made rapid growth possible and, as a core focus of retail investors who historically have a short attention span, the Opendoor renaissance has to happen fast.
Blend’s shift is quieter but equally identity-defining. Mortgage exposure continues to shrink as mortgage suite revenue declined year over year, while consumer banking suite revenue grows as a percentage of total business, up more than 30 percent and now representing nearly 40 percent of total revenue, an increase of 10% YoY. Operational discipline has improved meaningfully, and the looming Mr. Cooper roll off (despite being in 2028) forces an implicit repositioning. Blend is becoming a broader banking-infrastructure company, a direction shaped more by demand and mix than top-down strategy.
Identity Anchored in Footprint + Platform Shape
Rocket, eXp, News Corp, and Compass each leaned into the structural realities of their platforms.
Rocket’s gravitational center keeps shifting toward servicing, a recurring, cash-generating foundation that buffers the volatility of origination. The servicing portfolio now stands above 600 billion dollars across nearly 3 million loans, and the Redfin partnership is strengthening that funnel with higher application starts. The Mr. Cooper transaction introduces Jay Bray (former Mr.Cooper CEO) as Rocket Mortgage CEO, a leadership lens that understands servicing economics deeply. Rocket is evolving into a servicing-anchored ecosystem where origination is distribution, not identity.
eXp showed what geographic diversification looks like when executed deliberately: domestic softness counterbalanced by rapid international growth of nearly 70 percent year over year, supported by lower processing costs driven by automation that reduced per-transaction expense by roughly 100 dollars. Agent count outside the U.S. continued to climb, providing a natural hedge to U.S. market conditions.
News Corp’s digital real estate segment clarified its strategic center. REA Group continued demonstrating reliable yield strength and market leadership, Move posted solid results despite a mid-single-digit decline in traffic, and the exits from PropTiger and Housing Edge in India showed a return to focus. The identity here is consolidation around the high-performing core rather than sprawling multi-market ambition.
Compass leaned into scale as a strategy, not a byproduct. Transaction growth remained strong at more than 20 percent, agent count continued climbing at a similar rate, and adoption of platform tools from Make Me Sell to the Buyer Demand suite stayed broad. The upcoming Anywhere synergies, now expected to exceed earlier estimates, reinforce Compass’s identity as an acquisition-enabled distribution engine that turns scale into margin leverage.
Identity Was the Story of Q3
Tooey left a company that knows exactly what it is. Kaz joined one that must rebuild to find that clarity again.
Across the rest of proptech, the same theme played out: identity solidified, diversified, reconstructed, or anchored. The stories weren’t in the revenue lines, they were in the structural decisions, capital allocation choices, and operating footprints becoming more visible quarter by quarter.
The open question is whether those identities are the ones that will matter in the cycle ahead.
That’s a wrap. We’ll be back with weekly updates and, of course, full summaries to track how companies approach Q4.
Editor’s Notes:
- Figure Technologies was added to the index after a successful IPO on September 11th.
- Sonder’s earnings are not present in the table and this will be the final report in which Sonder is included in the index. After years of accounting and operational challenges, the company appeared to be catching a break following the release of its Q2 FY25 earnings in October. However, on November 9, 2025, Marriott International terminated its 20-year licensing agreement with Sonder, citing Sonder’s default.
In response, Sonder announced an immediate wind-down of its U.S. operations and stated that it planned to file for Chapter 7 bankruptcy for its U.S. business while initiating insolvency proceedings internationally. In its press release, Sonder’s interim CEO, Janice Sears, explained that the “integration with Marriott was substantially delayed due to unexpected challenges in aligning technology frameworks, leading to significant unanticipated integration costs and a sharp decline in revenue from participation in Marriott’s Bonvoy reservation system.These issues contributed to a severe loss of working capital and ultimately left the company no choice but to proceed with liquidation.” For additional details, refer to Sonder’s press release as well as the Q2FY25, Q1FY25, Q4 FY24 and Q3 FY24 reports. - ServiceTitan’s Q4 earnings are also not included, as their fiscal calendar runs one month behind most peers. With results not expected until December, they were omitted from this quarter’s graphic.
- MeridianLink was removed from the index on August 15th after announcing that it had entered into a definitive agreement to be acquired for $2 billion by funds advised by affiliates of Centerbridge Partners, a global investment firm. The deal was announced on August 11th and closed on October 20th.
Data Sources: Market cap and stock price data in chart come from Google Finance. Revenue and net income comes directly from companies Q3 earnings releases. EPS TTM data comes from Yahoo Finance.
This document is for informational purposes only and does not constitute financial, investment, legal, or tax advice. The content provided herein is provided on an "as is" basis without any warranty of any kind.
The information contained within this document is not intended to be a source of advice or investment analysis with respect to the material presented, and the information and/or documents contained in this document do not constitute investment advice.
The reader should consult with a qualified professional for advice regarding their individual situation before making any investment decision. No aspect of this document is intended to provide, nor should be construed as providing, any investment, tax or other professional advice. You should not rely on any material in this document to make (or refrain from making) any decision or take (or refrain from taking) any action.
The author and publisher of this document are not responsible for any actions taken as a result of reading this document, including but not limited to any loss or damage in any form suffered. Investments can go down as well as up and past performance is not necessarily indicative of future results.
Please be aware that all investment strategies and investments involve risk of loss, including the potential loss of all invested capital. Thus, funds invested are not guaranteed and there is a risk that you could lose some or all of your investment.